
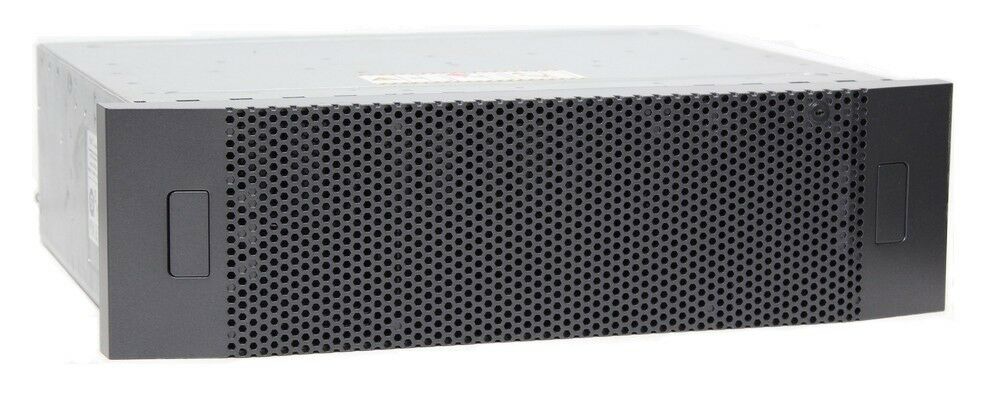
I’ve been running the VMs in my home lab on a ZFS pool on FreeNAS and now TruneNAS CORE made up of 600GB 10K SAS drives in a 6 x 2 way mirror configuration for some time and it works fine, but I’ve always wanted to have an all SSD high performance array. The price for used 400GB Hitachi Ultrastar SSD400M HUSML4040ASS600 has finally fallen to a level that makes them an option for a home lab setup. These were some of the best SAS SSDs available when they were released and they still have lots to offer for the home user. These drivers are MLC NAND with supper high endurance. For the rest of this blog when ever I say TrueNAS I’m referring to TrueNAS CORE the replacement for FreeNAS the free open source NAS.

I will be creating a 6 x 2 way mirror pool using a total of 12 drives which will give me 2,235GB of usable space. I will also have an Intel Optane 900p NVMe used as a SLOG to speed up sync writes which is a must when using NFS for VM storage. The XCP-ng hosts will access the storage over 2 10GbE links configured in LAG using LACP. This should give me excellent throughput, IOPS and low latency. This storage pool will only be used for VM operating system, data base and applications, the other data that does not need the performance of flash will be stored on another pool made up of 7.2K NL SAS drives.
What is NFS?
Network File System (NFS) is a distributed file system protocol originally developed by Sun Microsystems in 1984, allowing a user on a client computer to access files over a network much like local storage is accessed. NFS, like many other protocols, builds on the Open Network Computing Remote Procedure Call (ONC RPC) system. The Network File System is an open standard defined in RFCs, allowing anyone to implement the protocol. Source: wiki.
NFS is the recommended option for most use cases with XCP-ng because it will enable thin provisioning which will be important when doing snapshots and backups with Xen Orchestra. NFS is a solid, mature, high available, high performing foundation for virtualization environments. Compared to iSCSI and FC, NFS is relative easy to design, configure and manage. When configured correctly it offers strong performance and stability. That being said I still find that FC offers the lowest latency and most consistent performance followed by iSCSI. I can’t wait for the day Xen pulls it’s finger out and supports thin provisioning over FC/iSCSI.
You will read on the net that NFS is slow compared to block storage and the main reason that NFS is slow on ZFS is that it defaults to sync writes you can disable this and make NFS write async with the risk of data loss but not data corruption if the NFS server crashes. If you want to have high performance NFS and data integrity a NVMe SLOG with power loss protection is a must. You could run with sync off if your NAS is on a UPS and you automatically shut down the VMs before the NAS.
So, what are some of the advantages of using NFS? No additional hardware is necessary, you can use existing networking infrastructure and with 10GbE having storage and VM traffic on the same wire is easy and it’s less expensive to implement than FCoE/FC. It’s also well-known and well-understood protocol that is very mature. It can be troubleshooted with generic network tools such as Wireshark.
What are the disadvantages? With NFS v3 there is only a single session per connection, configuring for maximum bandwidth across multiple paths requires some care and attention. Same security concerns as with iSCSI, because everything is transferred in the clear, so care must be taken to isolate traffic (e.g., VLANs). NFS v3 does not have multipathing capability like iSCSI. pNFS v4.1 multipathing not available with all storage vendors. NFS can cause additional CPU overhead on the host. TCP can introduce latency for NFS.
Networking
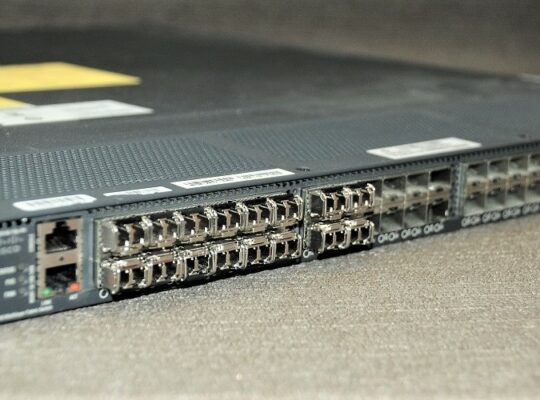
I’m using the Ubiquity EdgeSwitch 16 XG which offers the forwarding capacity to simultaneously process traffic on all ports at line rate without any packet loss. For its total, non‑blocking throughput, the EdgeSwitch supports up to 160 Gbps. This switch does not have all of the features of a high end enterprise switch but it more than capable of handling storage traffic. It is important to separate the back-end storage NFS network from any client traffic. This can be done using VLANs, network segmentation, or dedicated switches. This will allow for maximum performance and prevent unwanted access to your storage environment.
I have the following tuning in TrueNAS to get full 10GbE preformance. Without the sysctl tuning parameters FreeBSD and therefore TrueNAS does not preform well on NICs faster the 1GbE. Linux does not have any problem hitting 10GbE with the default settings. TrueNAS Scale will be running on Debian so once this has hit release I might look at swapping over to it.
sysctl tuning parameters
kern.ipc.maxsockbuf=16777216
net.inet.tcp.cc.abe=1
net.inet.tcp.abc_l_var=44
net.inet.tcp.initcwnd_segments=44
net.inet.tcp.minmss=536
net.inet.tcp.mssdflt=1460
net.inet.tcp.recvbuf_inc=65536
net.inet.tcp.recvbuf_max=4194304
net.inet.tcp.recvspace=65536
net.inet.tcp.sendbuf_inc=65536
net.inet.tcp.sendbuf_max=4194304
net.inet.tcp.sendspace=65536
iperf test
root: iperf3 -c 192.168.10.40
Connecting to host 192.168.10.40, port 5201
[  5] local 192.168.10.254 port 39882 connected to 192.168.10.40 port 5201
[ ID] Interval           Transfer     Bitrate         Retr  Cwnd
[  5]   0.00-1.00   sec   930 MBytes  7.80 Gbits/sec    0   4.08 MBytes
[  5]   1.00-2.00   sec  1.09 GBytes  9.38 Gbits/sec    0   8.88 MBytes
[  5]   2.00-3.00   sec  1.09 GBytes  9.38 Gbits/sec    0   13.7 MBytes
[  5]   3.00-4.00   sec  1.09 GBytes  9.38 Gbits/sec    0   14.2 MBytes
[  5]   4.00-5.00   sec  1.09 GBytes  9.38 Gbits/sec    0   14.2 MBytes
[  5]   5.00-6.00   sec  1.09 GBytes  9.38 Gbits/sec    0   14.2 MBytes
[  5]   6.00-7.00   sec  1.09 GBytes  9.38 Gbits/sec    0   14.2 MBytes
[  5]   7.00-8.00   sec  1.09 GBytes  9.38 Gbits/sec    0   14.2 MBytes
[  5]   8.00-9.00   sec  1.09 GBytes  9.37 Gbits/sec    0   14.2 MBytes
[  5]   9.00-10.00  sec  1.09 GBytes  9.38 Gbits/sec    0   14.2 MBytes
- - - - - - - - - - - - - - - - - - - - - - - - -
[ ID] Interval           Transfer     Bitrate         Retr
[  5]   0.00-10.00  sec  10.7 GBytes  9.22 Gbits/sec    0             sender
[  5]   0.00-10.41  sec  10.7 GBytes  8.86 Gbits/sec                  receiver

iperf Done.
Direct test to the pool from TrueNAS to test the SSDs
10 jobs run in parallel. As you can see we are averaging 139K IOPS and peaking at over 300K IOPS, not bad for 4K random write on modest hardware.
root@nas1:/mnt/vol3/test # sync ; fio --randrepeat=1 --direct=1 --gtod_reduce=1 --numjobs=10 --name=test --filename=test --bs=4k --iodepth=64 --size=4G --readwrite=randwrite --ramp_time=4 --group_reporting
test: (g=0): rw=randwrite, bs=(R) 4096B-4096B, (W) 4096B-4096B, (T) 4096B-4096B, ioengine=psync, iodepth=64
...
fio-3.19
Starting 10 processes
Jobs: 3 (f=3): [_(5),w(3),_(2)][95.0%][w=492MiB/s][w=126k IOPS][eta 00m:04s]
test: (groupid=0, jobs=10): err= 0: pid=14886: Sun Oct 25 18:47:35 2020
  write: IOPS=139k, BW=543MiB/s (570MB/s)(38.2GiB/71940msec)
   bw (  KiB/s): min=59846, max=1248802, per=100.00%, avg=559336.90, stdev=24875.33, samples=1410
   iops        : min=14958, max=312197, avg=139830.56, stdev=6218.83, samples=1410
  cpu          : usr=3.42%, sys=26.40%, ctx=1783614, majf=0, minf=1
  IO depths    : 1=100.0%, 2=0.0%, 4=0.0%, 8=0.0%, 16=0.0%, 32=0.0%, >=64=0.0%
     submit    : 0=0.0%, 4=100.0%, 8=0.0%, 16=0.0%, 32=0.0%, 64=0.0%, >=64=0.0%
     complete  : 0=0.0%, 4=100.0%, 8=0.0%, 16=0.0%, 32=0.0%, 64=0.0%, >=64=0.0%
     issued rwts: total=0,10008213,0,0 short=0,0,0,0 dropped=0,0,0,0
     latency   : target=0, window=0, percentile=100.00%, depth=64

Run status group 0 (all jobs):
  WRITE: bw=543MiB/s (570MB/s), 543MiB/s-543MiB/s (570MB/s-570MB/s), io=38.2GiB (40.0GB), run=71940-71940msec
TrueNAS Core NFS Share
I assume that you know how to create a storage pool, configure the NFS service and create a NFS share and make it available to XCP-ng hosts. If you need help check out the TrueNAS documentation and this video on YouTube. Bellow are the settings I have from my share.

Xen Orchestra – Creating the NFS SR
Creating a NFS SR (storage repository) in Xen Orchestra is a very easy process. It’s as simple as filling out the boxes and hitting the create button.

Note. NFS supports two mount types, soft mounts and hard mounts. You should use only hard mounts for reliability reasons. You should not use soft mounts, especially when there is a possibility of NFS timeouts due to storage server outage or network miss-configuration/outage. Race conditions can occur and or the mount can go read only as a result of these timeouts, which can lead to data corruption.
The below info is taken from NetApp which are one of the best NAS providers out there when it comes to using NFS for VM storage.
A Hard mount is generally used for block resources like a local disk or SAN. When a NFS filesystem mount is a Hard mount, an NFS request affecting any part of the mounted resource is issued repeatedly until the request is satisfied (for example, the server crashes and comes back up later). Once the server is back online, the program will continue to execute undisturbed from the state where it was during server crash.
https://kb.netapp.com/Advice_and_Troubleshooting/Data_Storage_Software/ONTAP_OS/What_are_the_differences_between_hard_mount_and_soft_mount
As you can see below the performance of the NFS share is realy good. This SR has 14 VMs and 35 docker containers running on it.
[13:58 xen-host-01 ~]# nfsiostat
192.168.110.40:/mnt/vol3/xen-vm-storage/1f2d9426-fb76-9900-c445-0dc02746efb7 mounted on /run/sr-mount/1f2d9426-fb76-9900-c445-0dc02746efb7:
op/s   rpc bklog
132.02 0.00
read:  ops/s  kB/s     kB/op  retrans  avg RTT (ms) avg exe (ms)
       53.735 1891.246 35.196 0 (0.0%) 1.469        1.711
write: ops/s  kB/s     kB/op  retrans  avg RTT (ms) avg exe (ms)
       75.443 1211.640 16.060 0 (0.0%) 0.283        0.583
There is currently an issue with the latency reporting in Xen Orchestra. There is a discussion on the XCP-ng forums here, with a fix being worked on.


Performance Tests Using fio
These tests are done in a CentOS 7 VM running on XCP-ng 8.2 host. The VM disk resides on a NFS SR on TrueNAS mounted over 10GbE network. This show the performance of 1 VM to the storage.
Random write test for IOP/s 4K
[root@cloud ~]# sync;fio --randrepeat=1 --ioengine=libaio --direct=1 --gtod_reduce=1 --name=test --filename=test --bs=4k --iodepth=256 --size=4G --readwrite=randwrite --ramp_time=4
test: (g=0): rw=randwrite, bs=(R) 4096B-4096B, (W) 4096B-4096B, (T) 4096B-4096B, ioengine=libaio, iodepth=256
fio-3.7
Starting 1 process
test: No I/O performed by libaio, perhaps try --debug=io option for details?:04s]

test: (groupid=0, jobs=1): err= 0: pid=22582: Mon Oct 19 07:27:39 2020
  write: IOPS=19.4k, BW=75.9MiB/s (79.6MB/s)(3812MiB/50228msec)
   bw (  KiB/s): min=61512, max=98416, per=99.80%, avg=77570.10, stdev=5973.31, samples=100
   iops        : min=15378, max=24604, avg=19392.46, stdev=1493.34, samples=100
  cpu          : usr=7.45%, sys=24.65%, ctx=29835, majf=0, minf=24
  IO depths    : 1=0.1%, 2=0.1%, 4=0.1%, 8=0.1%, 16=0.1%, 32=0.1%, >=64=107.5%
     submit    : 0=0.0%, 4=100.0%, 8=0.0%, 16=0.0%, 32=0.0%, 64=0.0%, >=64=0.0%
     complete  : 0=0.0%, 4=100.0%, 8=0.0%, 16=0.0%, 32=0.0%, 64=0.0%, >=64=0.1%
     issued rwts: total=0,975737,0,0 short=0,0,0,0 dropped=0,0,0,0
     latency   : target=0, window=0, percentile=100.00%, depth=256

Run status group 0 (all jobs):
  WRITE: bw=75.9MiB/s (79.6MB/s), 75.9MiB/s-75.9MiB/s (79.6MB/s-79.6MB/s), io=3812MiB (3998MB), run=50228-50228msec

Disk stats (read/write):
    dm-0: ios=1/1042656, merge=0/0, ticks=13/7480956, in_queue=7482678, util=99.91%, aggrios=19/1037819, aggrmerge=0/10827, aggrticks=47/7418086, aggrin_queue=7417879, aggrutil=99.68%
  xvda: ios=19/1037819, merge=0/10827, ticks=47/7418086, in_queue=7417879, util=99.68%
Random Read test for IOP/s 4K
[root@cloud ~]# sync;fio --randrepeat=1 --ioengine=libaio --direct=1 --gtod_reduce=1 --name=test --filename=test --bs=4k --iodepth=256 --size=4G --readwrite=randwrite --ramp_time=4
test: (g=0): rw=randwrite, bs=(R) 4096B-4096B, (W) 4096B-4096B, (T) 4096B-4096B, ioengine=libaio, iodepth=256
fio-3.7
Starting 1 process
test: No I/O performed by libaio, perhaps try --debug=io option for details?:04s]

test: (groupid=0, jobs=1): err= 0: pid=22582: Mon Oct 19 07:27:39 2020
  write: IOPS=19.4k, BW=75.9MiB/s (79.6MB/s)(3812MiB/50228msec)
   bw (  KiB/s): min=61512, max=98416, per=99.80%, avg=77570.10, stdev=5973.31, samples=100
   iops        : min=15378, max=24604, avg=19392.46, stdev=1493.34, samples=100
  cpu          : usr=7.45%, sys=24.65%, ctx=29835, majf=0, minf=24
  IO depths    : 1=0.1%, 2=0.1%, 4=0.1%, 8=0.1%, 16=0.1%, 32=0.1%, >=64=107.5%
     submit    : 0=0.0%, 4=100.0%, 8=0.0%, 16=0.0%, 32=0.0%, 64=0.0%, >=64=0.0%
     complete  : 0=0.0%, 4=100.0%, 8=0.0%, 16=0.0%, 32=0.0%, 64=0.0%, >=64=0.1%
     issued rwts: total=0,975737,0,0 short=0,0,0,0 dropped=0,0,0,0
     latency   : target=0, window=0, percentile=100.00%, depth=256

Run status group 0 (all jobs):
  WRITE: bw=75.9MiB/s (79.6MB/s), 75.9MiB/s-75.9MiB/s (79.6MB/s-79.6MB/s), io=3812MiB (3998MB), run=50228-50228msec

Disk stats (read/write):
    dm-0: ios=1/1042656, merge=0/0, ticks=13/7480956, in_queue=7482678, util=99.91%, aggrios=19/1037819, aggrmerge=0/10827, aggrticks=47/7418086, aggrin_queue=7417879, aggrutil=99.68%
  xvda: ios=19/1037819, merge=0/10827, ticks=47/7418086, in_queue=7417879, util=99.68%
Sequential write test for throughput 4M
    [root@cloud ~]# sync;fio --randrepeat=1 --ioengine=libaio --direct=1 --gtod_reduce=1 --name=test --filename=test --bs=4M --iodepth=256 --size=4G --readwrite=write --ramp_time=4
    test: (g=0): rw=write, bs=(R) 4096KiB-4096KiB, (W) 4096KiB-4096KiB, (T) 4096KiB-4096KiB, ioengine=libaio, iodepth=256
    fio-3.7
    Starting 1 process
    test: No I/O performed by libaio, perhaps try --debug=io option for details?s]

    test: (groupid=0, jobs=1): err= 0: pid=23003: Mon Oct 19 07:34:23 2020
      write: IOPS=130, BW=789MiB/s (828MB/s)(3004MiB/3806msec)
       bw (  KiB/s): min=442368, max=630784, per=65.59%, avg=530139.43, stdev=85358.69, samples=7
       iops        : min=  108, max=  154, avg=129.43, stdev=20.84, samples=7
      cpu          : usr=2.23%, sys=10.75%, ctx=1459, majf=0, minf=24
      IO depths    : 1=0.2%, 2=0.4%, 4=0.8%, 8=1.6%, 16=3.2%, 32=6.5%, >=64=193.8%
         submit    : 0=0.0%, 4=100.0%, 8=0.0%, 16=0.0%, 32=0.0%, 64=0.0%, >=64=0.0%
         complete  : 0=0.0%, 4=99.9%, 8=0.0%, 16=0.0%, 32=0.0%, 64=0.0%, >=64=0.1%
         issued rwts: total=0,496,0,0 short=0,0,0,0 dropped=0,0,0,0
         latency   : target=0, window=0, percentile=100.00%, depth=256

    Run status group 0 (all jobs):
      WRITE: bw=789MiB/s (828MB/s), 789MiB/s-789MiB/s (828MB/s-828MB/s), io=3004MiB (3150MB), run=3806-3806msec

    Disk stats (read/write):
        dm-0: ios=0/95914, merge=0/0, ticks=0/1092905, in_queue=1100075, util=92.76%, aggrios=0/96266, aggrmerge=0/0, aggrticks=0/1100694, aggrin_queue=1100653, aggrutil=92.63%
      xvda: ios=0/96266, merge=0/0, ticks=0/1100694, in_queue=1100653, util=92.63%
Sequential Read test for throughput 4M
[root@cloud ~]# sync;fio --randrepeat=1 --ioengine=libaio --direct=1 --gtod_reduce=1 --name=test --filename=test --bs=4M --iodepth=256 --size=4G --readwrite=read --ramp_time=4
test: (g=0): rw=read, bs=(R) 4096KiB-4096KiB, (W) 4096KiB-4096KiB, (T) 4096KiB-4096KiB, ioengine=libaio, iodepth=256
fio-3.7
Starting 1 process
test: No I/O performed by libaio, perhaps try --debug=io option for details?s]

test: (groupid=0, jobs=1): err= 0: pid=23212: Mon Oct 19 07:37:58 2020
   read: IOPS=182, BW=1258MiB/s (1320MB/s)(2420MiB/1923msec)
   bw (  KiB/s): min=737280, max=752159, per=57.81%, avg=744970.33, stdev=7452.18, samples=3
   iops        : min=  180, max=  183, avg=181.67, stdev= 1.53, samples=3
  cpu          : usr=0.52%, sys=16.08%, ctx=1030, majf=0, minf=24
  IO depths    : 1=0.3%, 2=0.6%, 4=1.1%, 8=2.3%, 16=4.6%, 32=9.1%, >=64=274.6%
     submit    : 0=0.0%, 4=100.0%, 8=0.0%, 16=0.0%, 32=0.0%, 64=0.0%, >=64=0.0%
     complete  : 0=0.0%, 4=99.9%, 8=0.0%, 16=0.0%, 32=0.0%, 64=0.0%, >=64=0.1%
     issued rwts: total=350,0,0,0 short=0,0,0,0 dropped=0,0,0,0
     latency   : target=0, window=0, percentile=100.00%, depth=256

Run status group 0 (all jobs):
   READ: bw=1258MiB/s (1320MB/s), 1258MiB/s-1258MiB/s (1320MB/s-1320MB/s), io=2420MiB (2538MB), run=1923-1923msec

Disk stats (read/write):
    dm-0: ios=93361/14, merge=0/0, ticks=810107/85, in_queue=810869, util=98.32%, aggrios=96256/15, aggrmerge=0/0, aggrticks=829379/81, aggrin_queue=829406, aggrutil=97.92%
  xvda: ios=96256/15, merge=0/0, ticks=829379/81, in_queue=829406, util=97.92%
Conclusion
TrueNAS Open Storage will unify what was formerly known as FreeNAS and is now named TrueNAS CORE into a single software image and brand with TrueNAS now identified as TrueNAS Enterprise, automatically inheriting all TrueNAS CORE features. TrueNAS CORE is still open and free, just with more features and a new brand.

TrueNAS CORE is a more than capable system that can deliver performance and data integrity with modest hardware. Something like this would normally cost a fortune from one of the major storage vendors. If you are in the Enterprise space there is TrueNAS Enterprise which is basically the same as TrueNAS CORE with the main differences being that it’s built on custom hardware and finally tuned for maximum performance, dual controllers for high availability, Fibre Channel and support.


I have to thank you for the efforts you have put in penning this site.
I’m hoping to view the same high-grade blog posts by you later on as well.
In fact, your creative writing abilities has inspired me to get my very own blog now
😉